Version 1.01, October 2019
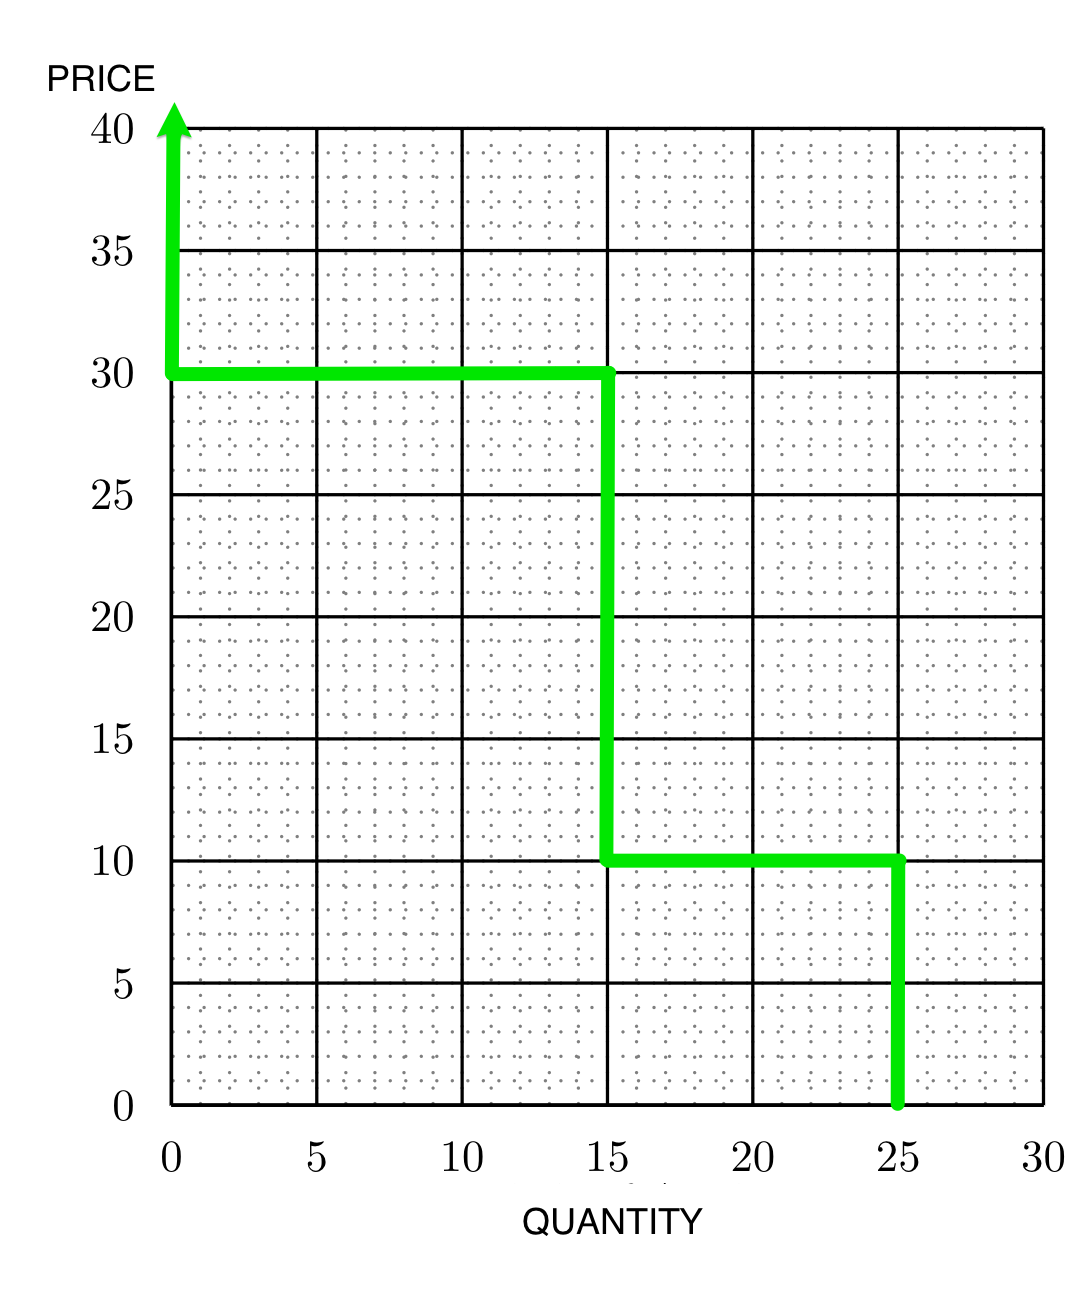
The demand curve tells us the total amount of a good that buyers would want to buy at each possible price. For this example we will use the information on the distribution of buyer values in Table 1 to construct the Demand Table (Table 2) and then to draw the Demand Curve (Figure 1).
| Types | Units | Buyer Value |
| High-Value | 15 | 30€ |
| Low-Value | 10 | 10€ |
The Demand Table shows the units of the good that demanders want to buy at all possible prices. The highest Buyer Value is 30€. If the price is above 30€, no buyer will want to buy any unit. So for all prices above 30€, the quantity demanded is 0. We record this fact in the first line of Table 2.
| Price Range | Amount Demanded |
| \(P\)>30€ | 0 |
| 10€<\(P\)<30€ | 15 |
| \(P\)<10€ | 25 |
If the price is between 10€ and 30€, all high-value demanders can make profits by buying a unit, but low-value demanders will lose money if they buy. So at prices between 10€ and 30€, the total demand is 15 units, and we write 15 as the amount demanded in the second line of Table 2.
If the price is below 10€, then all of the high-value demanders and all of the low-value demanders can make a profit by buying. So the total demand at any price below 10€ is 25 units. Therefore we enter 25 as the amount demanded in the bottom line of Table 2.
We use the information in the Demand Table (Table 2) to draw the demand curve (Figure 1. At prices above 30€ nobody will want to buy. Therefore the demand curve includes a vertical line extending from the point \((0,30)\) to the top of the box. At any price between 10€ and 30€, the total quantity demanded is 15 units. This means that the demand curve includes a vertical segment running from \((15,10)\) to \((15,30)\). At prices below 10, all demanders want to buy so total demand will be 25 units. The demand curve, therefore, includes a vertical segment running from \((25,0\) to \((25,10)\).

At a price of exactly 10€, all demanders with high buyer value will want to buy. Demanders with low buyer value would be indifferent between buying or not, and hence we cannot know how many of them will buy. So at a price of 10€, the total quantity demanded can be any amount between 15 and 25 units. This implies that the demand curve includes a horizontal segment running from the point \((15,10)\) to the point \((25,10)\).
Similarly, the demand curve also includes a horizontal segment at a price of exactly 30€ that runs from the point (0,30) to the point (15,30) showing that, at this price, demanders with high buyer value are indifferent between buying or not while demanders with low buyer value do not want to buy.
If you think that the height of a demander as representing his buyer value, the demand curve merely lines up demanders from the tallest to the shortest.