Version 1.01, October 2019
The Supply Function tells us the total amount of a good that suppliers would want to sell at each possible price.
For this example we will use the information on the distribution of production costs in Table 1 to construct the Supply Table (Table 2) and then to draw the Supply Curve (Figure 1).
| Types | Units | Cost per unit |
| Low-Cost | 20 | 5€ |
| High-Cost | 10 | 25€ |
In the example, 20 units can be produced at a low-cost of 5€, and 10 units at a high-cost of 25€. (This is the same as if there were 20 suppliers with Seller Cost of 5€ who can produce at most one unit of the good, and 30 suppliers with Seller Cost of 25€ who can also produce at most one unit.) At any price below 5€ a unit nobody would want to supply any units because anyone producing would lose money, so the total number of units supplied to the market would be zero. We therefore enter 0 as the amount supplied in the first line of Table 2.
| Price Range | Amount Demanded |
| \(P\)<5€ | 0 |
| 5€<\(P\)<25€ | 20 |
| \(P\)>25€ | 30 |
If the price, \(P\), is between 5€ and 25€, suppliers producing the 20 low-cost units can make money by selling their units, since their costs are only 5€. But the high-cost suppliers would lose money if they sold for any price that is below 25€. Therefore at prices between 5€ and 25€, all low-cost suppliers but none of the high-cost suppliers will want to sell their units. The total quantity supplied at prices between 5€ and 25€ will be exactly 20 units, and so we enter 20 as the amount supplied in the second line of the Table 2.
At prices above 25€, all of the high-cost suppliers and all of the low-cost suppliers can make money by selling. Since 10 units can be produced at high-cost and 20 at low-cost, the total amount supplied at prices above 25€ is 30 units. Therefore we enter 30 as the amount supplied in the last line of the Supply Table.
The first step to draw the supply curve is to draw a pair of axes, with price measured on the vertical axis and quantity measured on the horizontal axis. (Refer to Figure 1.)
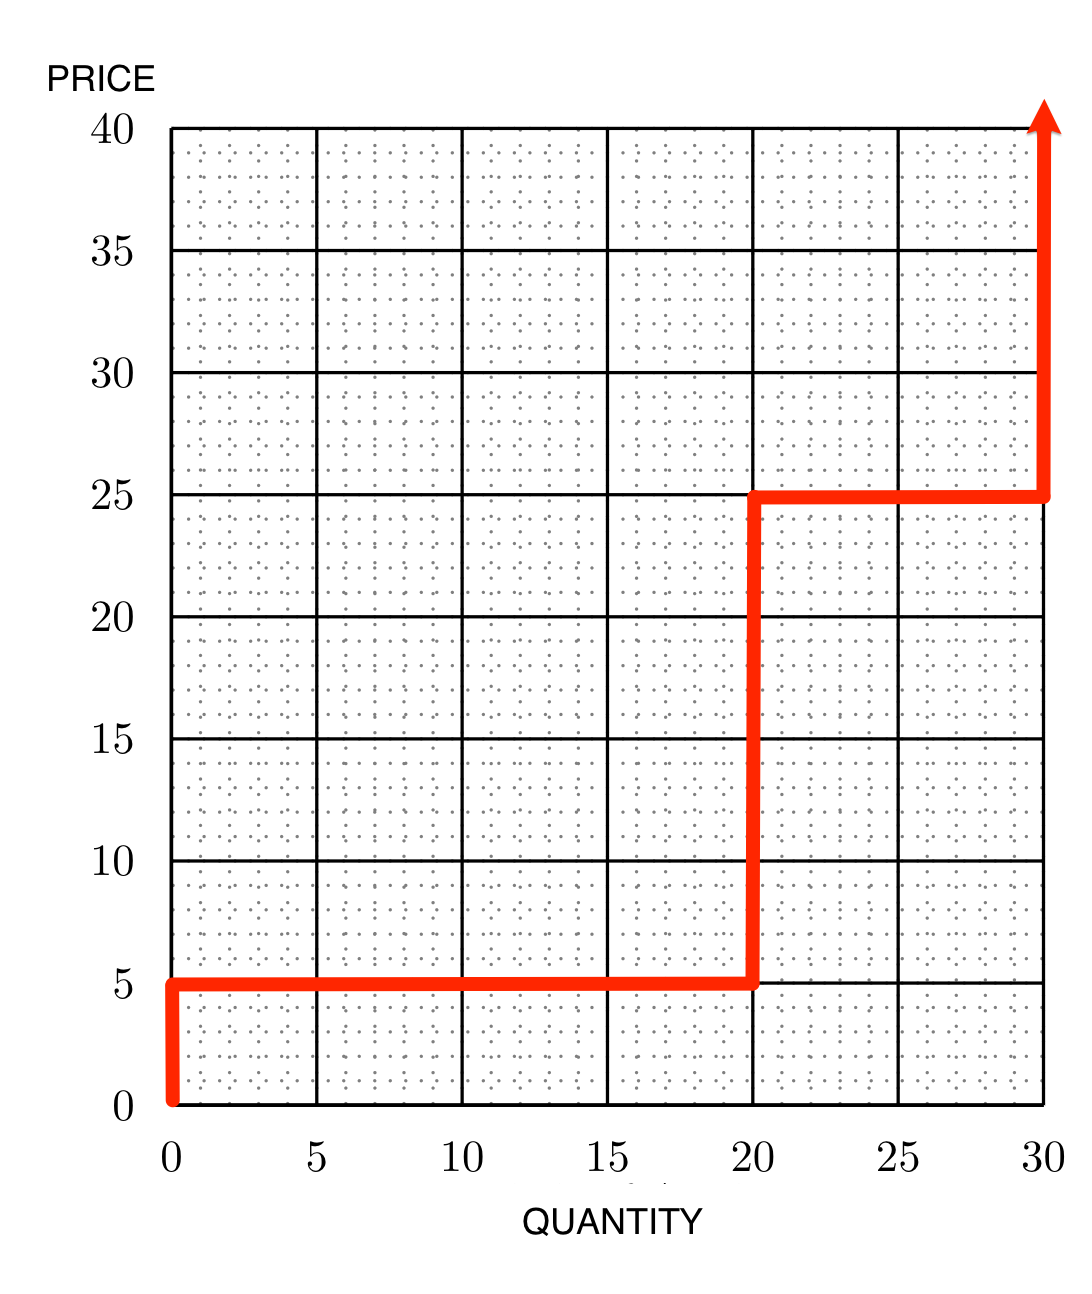
As we see from the Supply Table (Table 2), at prices below 5€, the amount of apples supplied is 0. Thus the supply curve must show that at these prices no apples will be supplied. This means that the supply curve includes a vertical line that follows the vertical axis from the origin \((0,0)\) up to the point \((0,5)\) where price is 5€ and quantity is 0.
From the Supply Table, we see that at any price between 5€ and 25€, the total quantity supplied is 20 units. Therefore the supply curve includes a vertical line segment drawn from the point \((20,5)\) up to the point \((20,25)\).
At prices above 25€, we see from the Supply Table that the quantity supplied is 30 units. Therefore the supply curve includes a vertical line starting at the point \((30, 25)\) and going straight up to the top of the box.
At a price of 5€, by producing a high-cost unit a supplier would lose money, while suppliers producing low-cost units won’t make any money, but they won’t lose any money either. They will be indifferent between selling and not selling and hence we cannot know whether none, some or all of the 20 low-cost units will be produced. We show this fact by adding a horizontal segment at a price of 5€ on our supply curve showing that at a 5€ price we can have any number of units from 0 to 20. On the graph, this segment is a line from the point \((0,5)\) to the point \((20,5)\).
At a price of 25€, all suppliers of the 20 low-cost units will want to produce, while suppliers of the 10 high-cost units would just break even. So at a price of 25€, the total quantity supplied can be any amount between 20 and 30 units. This implies that the supply curve includes a horizontal segment at a price of 25€. This segment runs from the point \((20,25)\) to the point \((30,25)\).
If you think that the height of a supplier as representing her seller cost, the supply curve merely lines up supplier from the shortest to the tallest.