Version 1.01, October 2019
A sales tax reduces the total profits of buyers and sellers, since the tax causes the price paid by buyers to rise and the price received by sellers to fall. On the other hand, the government collects tax revenue that could be used to provide beneficial goods and services or could even be refunded to market participants. It would be interesting to know whether the tax revenue collected by the government is greater than, less than, or equal to the amount of profits lost by buyers and sellers because of the tax.
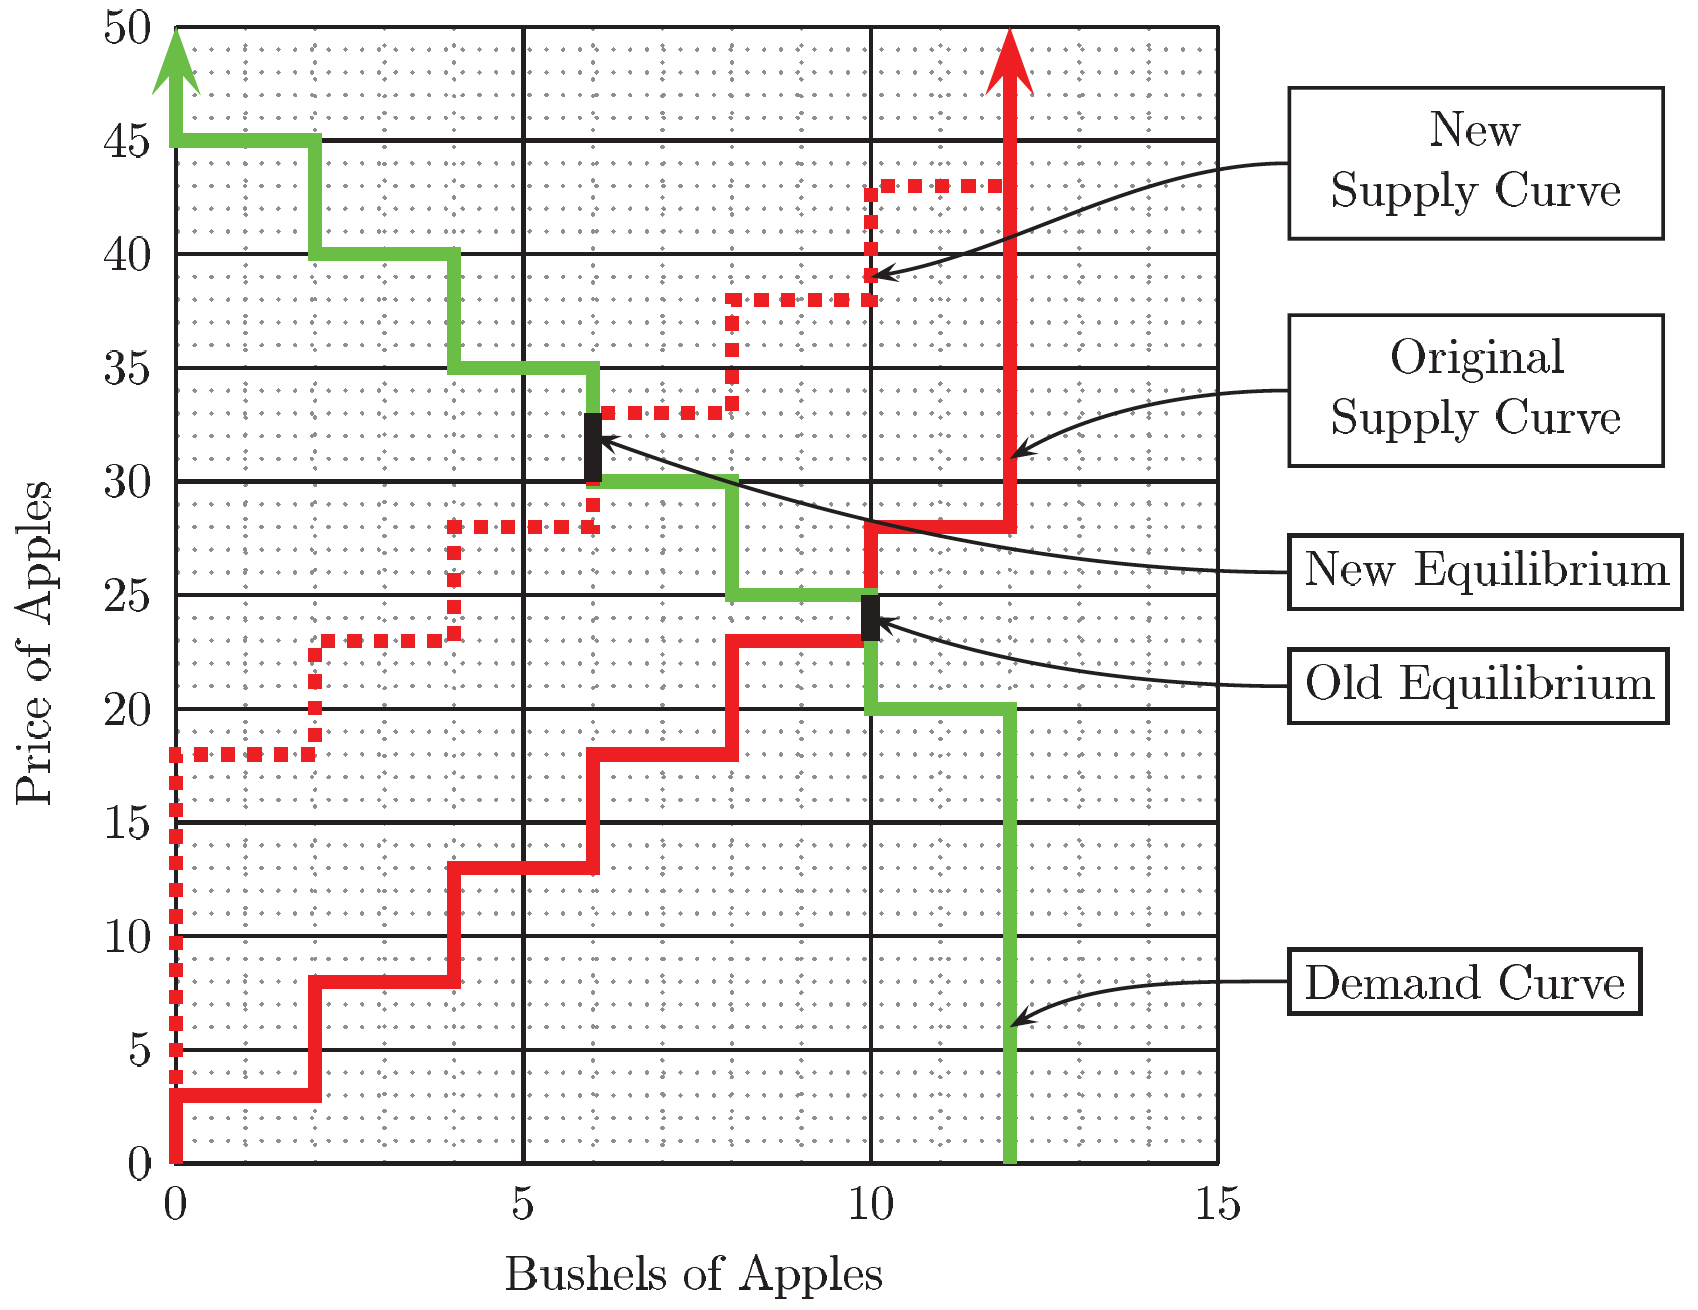
If supply curves slope up and demand curves slope down, the answer to this question is that a sales tax will reduce total profits of sellers and buyers by more than the amount of tax revenue collected. The difference between the loss in total profits of market participants and the amount of tax revenue is called the excess burden or deadweight loss of the tax. The reason that a sales tax causes excess burden is that the tax prevents some trades that would be profitable for both buyer and seller in the absence of a tax. We will explore two methods to calculate geometrically the tax revenue and excess burden. We will use the example shown in Figure 1 where a 15€ sales tax is imposed on sellers. In the absence of tax the competitive equilibrium price is 24€ and the number of bushels sold is 10.
A first method finds the excess burden of a tax by first calculating the sum of sellers’ and buyers’ profits without the tax, then calculating the sum of sellers’ profits, buyers’ profits, and tax revenue when the tax is in place, and finally subtracting the latter sum from the former.
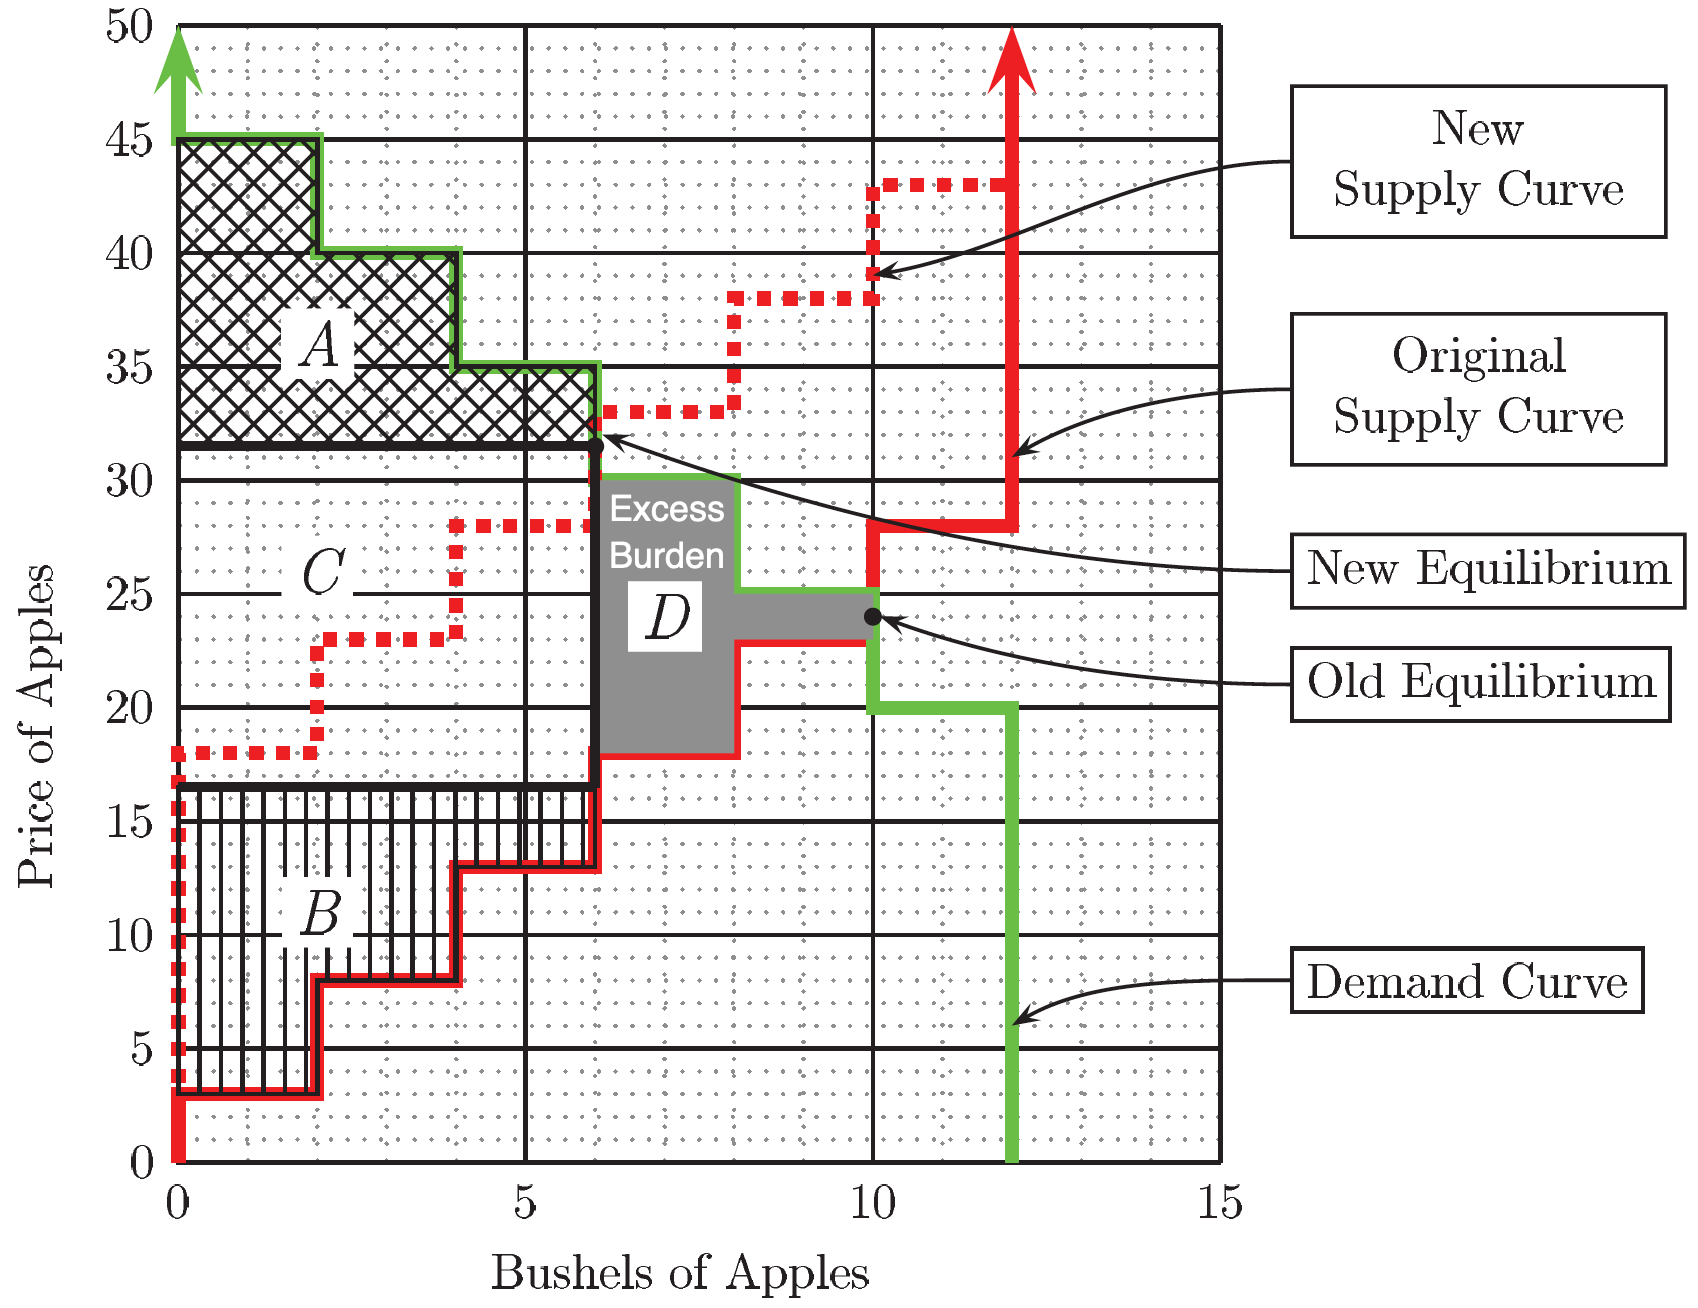
Without a tax, total profits of buyers and sellers is represented by the area between the demand and the original supply curve to the left of the point marked “Old Equilibrium.” In Figure 2, this area is the sum of the areas of the four regions marked \(A\), \(B\), \(C\), and \(D\).
When a 15€ sales tax is collected from sellers, the equilibrium price rises to 31.50€ and only 6 bushels of apples are sold. With the tax in place, the total profit of demanders is equal to the area of the region marked \(A\). When suppliers have to pay the tax, although the price is 31.50€, the after-tax revenue received by suppliers is only 31.50€\(-\)15€\(=\)16.50€ per bushel of apples. Their total profit is equal to the area of the region labeled \(B\).
Total tax revenue is the number of bushels sold with the tax times the tax rate. The height of the box labeled \(C\) is equal to the tax rate (15€) and the width of \(C\) is the number of bushels sold (6). Therefore total tax revenue is equal to the area of region \(C\).
We observed that total profits in the absence of a tax is the sum of the areas of regions \(A\), \(B\), \(C\), and \(D\). We found that when the tax is collected, total profits plus tax revenue is the sum of the areas of regions \(A\), \(B\), and \(C\). The excess burden (or dead-weight-loss) from the sales tax is the difference between these two areas, which is just the area of region \(D\).
A second, faster, method computes the gains from trade lost from the transactions that the tax prevented to happen. That is exactly the excess burden or dead-weight-loss. From Figure 2, we observe that there are 10 bushels of apples sold at the equilibrium before the tax, while only 6 bushels of apples are sold when a 15€ sales tax is collected from sellers. Therefore, the tax prevents the last 4 transactions from happening. The gains from trade of those 4 transactions are represented by the region marked \(D\), corresponding with the difference between the consumer buyer value (the demand) and the seller cost (the supply).1
You may have noticed that the gains from trade of each of these transactions are lower than the tax.↩︎