Version 1.01, October 2019
A demander’s consumer surplus from purchasing a unit of the good is defined to be the difference between his reservation price (his maximum willingness-to-pay) and the price he actually has to pay. A supplier’s seller profit from selling a unit of the good is defined to be the difference between the price she actually receives and her reservation price (her minimum willingness-to-accept).
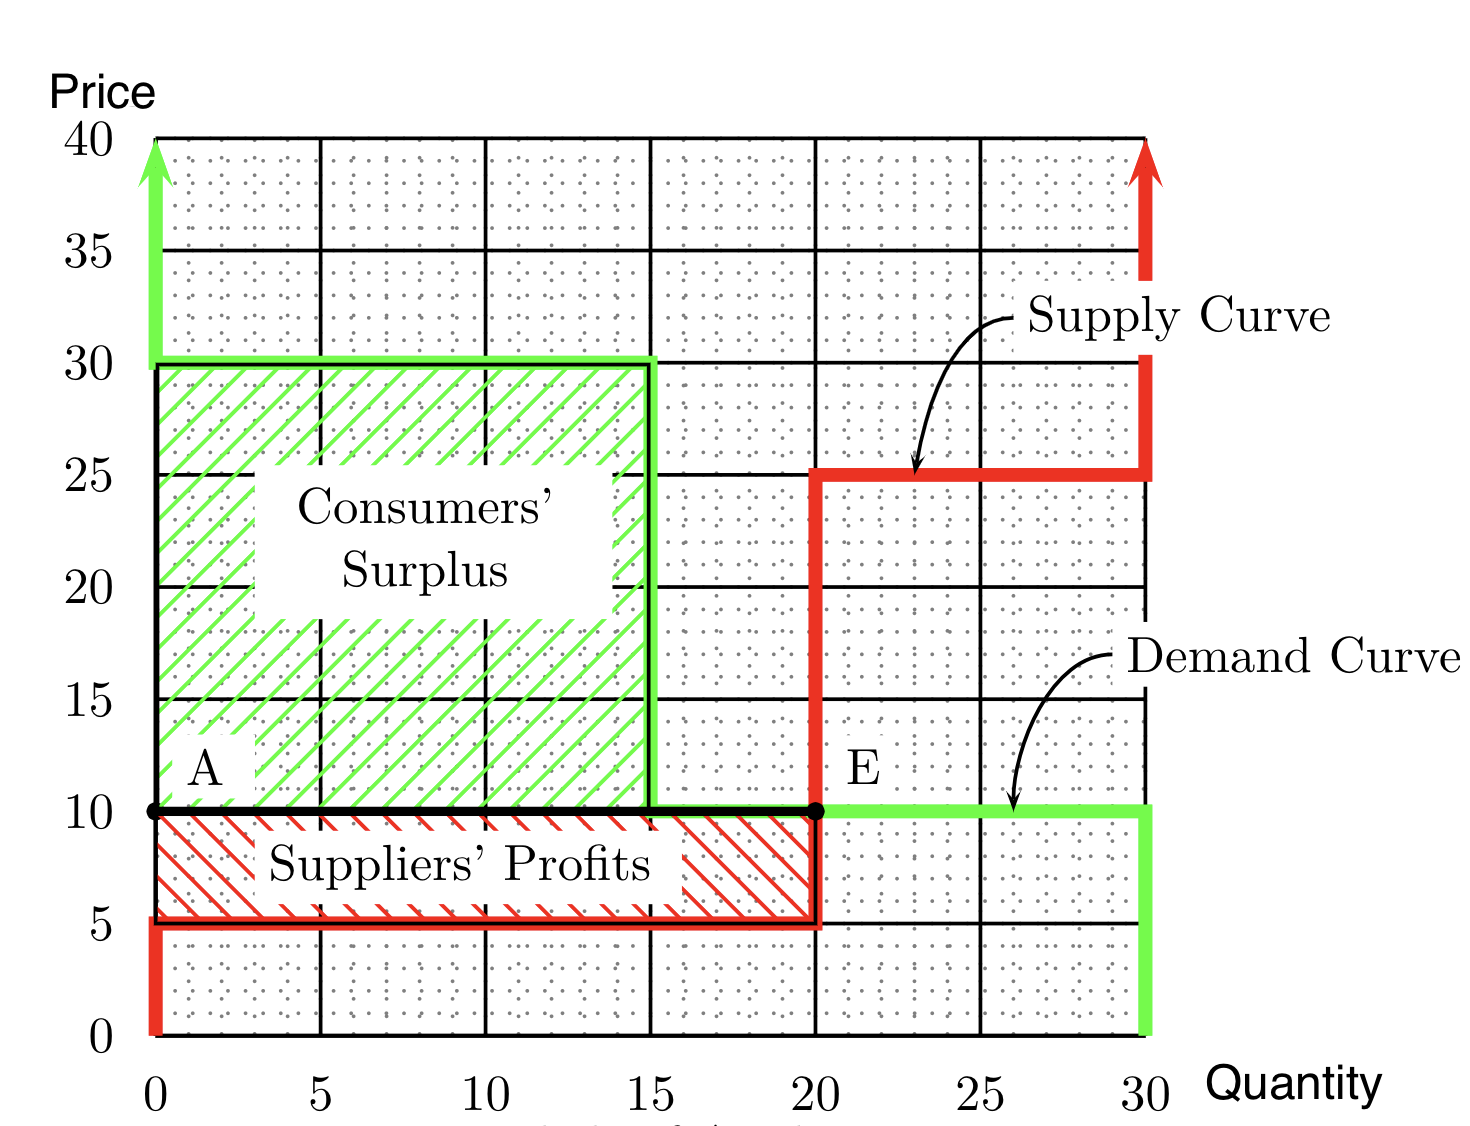
Figure 1 shows a useful geometric way to find total profits in competitive equilibrium from the graph of the supply and demand curves. First identify the equilibrium price. The area below the equilibrium price and above the supply curve represents the total profits made by suppliers.1 The area above the equilibrium price and below the demand curve represents the total consumers’ surplus. The geometry works because for each unit sold, the vertical distance from the equilibrium price to the supply curve equals the profit made by the seller for that unit. If we add these profits over all units sold, we have the total profits made by suppliers, which is the area of the region labeled “Suppliers’ Profits.” Similarly, for each unit sold, the vertical distance between the demand curve and the equilibrium pice is the Consumer’s Surplus (Demander’s Profit) made by the buyer of that unit. Adding these surpluses over all units sold, we have the total consumers’ surplus, which is the area of the region labeled “Consumers’ Surplus.”
If there were sunk (or non-recoverable fixed costs), total profits would equal this area minus the sunk costs.↩︎