Version 1.01, October 2019
In this experiment you will
Learn about the way that a tax shifts the supply curve or the demand curve.
Learn to distinguish between collecting a tax and bearing the cost of a tax
Learn to determine who will bear the cost of a tax or tax incidence.
Observe the equivalence between a tax collected from suppliers and an equal tax collected from demanders.
Learn to identify and measure the revenue collected by a tax and the excess burden imposed by a tax.
Your instructor will provide LabNotes: the relevant information to study and interpret the results of the experiment. Use the data in the LabNotes to answer the questions in this section. The LabNotes will contain the following tables (identified by  ):
):
Transactions, prices, and profits in the last round of each session (tables \(A\) , \(B\) , and \(C\) ).
Distribution of types (tables \(D\) ).
Use the information in tables \(A\) , \(B\) and \(C\) to complete Table 1. Count the number of transactions recorded in each session and find the mean (average) price by adding all the prices posted and dividing by the number of transactions. Find total profits of sellers and of buyers by adding the corresponding columns in these tables. Find total profits of all traders by adding total profits of sellers and total profits of buyers.
| Session 1 | Session 2 | Session 3 | |
| Mean Price | |||
| Number of Transactions | |||
| Total Profits of Buyers | |||
| Total Profits of Sellers | |||
| Total Taxes Collected | |||
| Total Profits Plus Taxes Collected |
Answer each of the following questions by comparing the outcome in the last round of Session 2, when sellers had to pay an excise tax, to the outcome in the last round of session 1, when there were no taxes.
The tax collected from sellers caused the average price paid by buyers to (rise? fall?) by (more than? less than? about the same ?) amount as the per-unit tax?
How much tax revenue was collected in Session 2?
Total profits of buyers and sellers fell by (more than? less than? about the same as?) the amount of tax revenue collected?
Answer each of these questions by comparing the outcome in Session 3, when buyers had to pay an excise tax, to the outcome in Session 1, when there were no taxes.
The tax collected from buyers caused the average price paid by sellers to (rise? fall?) by (more than? less than? about the same?) amount as the per-unit tax?
The tax collected from buyers caused the cost of apples (including the price and the tax) to buyers to (rise? fall?) by (more than? less than? about the same?) amount as the per-unit tax?
How much tax revenue was collected in Session 3?
Total profits of buyers and sellers fell by (more than? less than? about the same as?) the amount of tax revenue collected?
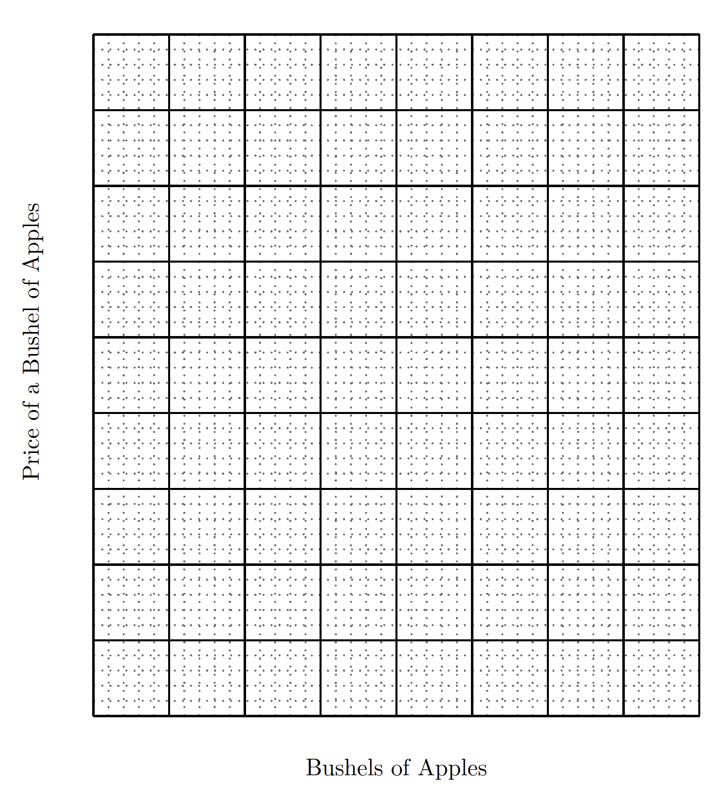
In Figure 1, draw the competitive supply and demand curves for Session 1 of your experiment, where there is no tax. (Use the information on the distribution of Seller Costs and Buyer Values that you recorded in Table \(D\) of your Lab Notes. [Click here and here if you need help on how to draw supply and demand curves.] On the same graph, add a dashed line to show the supply curve that applies when suppliers have to pay a tax of 15€, as in Session 2.
In Figure 2, draw the no-tax supply and demand curves as you did in Figure 1. Now use a dashed line to show the demand curve that applies when demanders have to pay a tax of 15€, as in Session 3.
Determine the competitive equilibrium prices and number of transactions from Figures 1 and 2. Use that information to complete Table 2, by calculating total profits of buyers, total profits of sellers, and total taxes collected by the government. If competitive equilibrium theory predicts a range of possible equilibrium prices, record the corresponding ranges in the table. [Remember that here you are calculating the values predicted by competitive theory, not the actual outcomes observed in the experiment.]
| No Tax (Session 1) | Sellers Pay Tax (Session 2) | Buyers Pay Tax (Session 3) | |
| Mean Price | |||
| Number of Transactions | |||
| Total Profit of Buyers * | |||
| Total Profit of Sellers * | |||
| Total Taxes Collected | |||
| Total of Profits Plus | |||
| Taxes Collected | |||
| Excess Burden** |
In Sessions 2 and 3, profits are after-tax profits. If there is a range of equilibrium prices, use the midpoint of this range to calculate total profits of buyers and of sellers.
** Click here if you need help on calculating the excess burden.
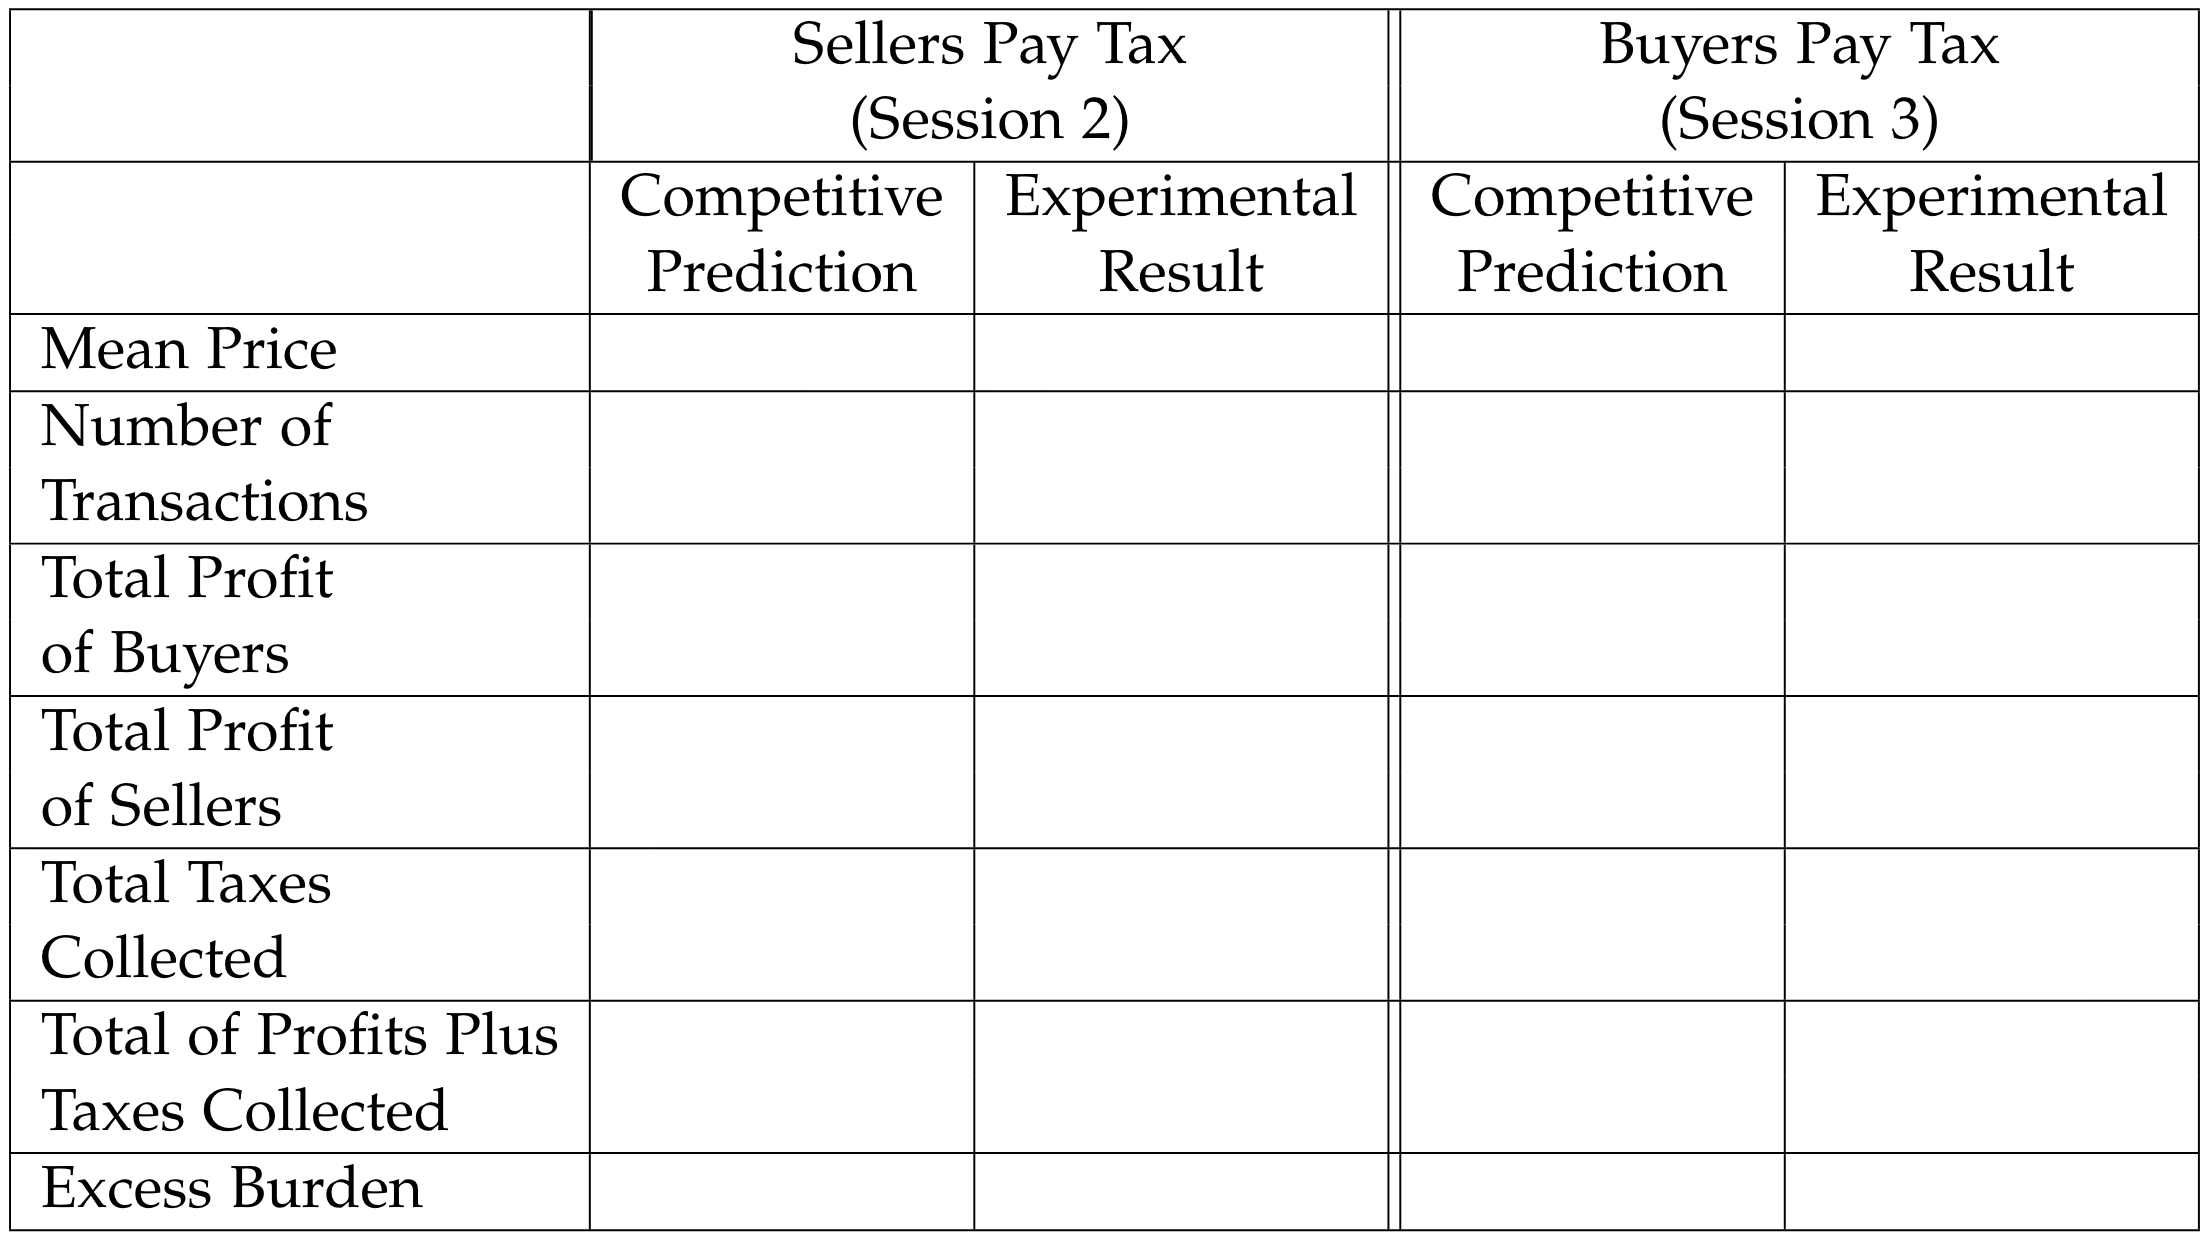
Use the table in Figure 3 to compare the experimental results of the last rounds of Sessions 2 and 3 (you recorded these in Table 1) with the competitive predictions that you found for Table 2. (Profits in Sessions 2 and 3 should be after-tax profits.)